
The number of business organizations leveraging interactive data visualization to gain insight into a large amounts of data has continued to increase. One of the data visualization software tools popular among businesses is Tableau.
With Tableau, businesses with a high volume of data to sort are finding it easier to make sense of their data, recognize new patterns and make good business decisions based on the indicators provided by the software. However, there is a growing concern over the best ways to share the Tableau dashboard.
SEE: Still need to set up your Tableau dashboard? Learn how with this guide.
We will highlight the different ways you can share your Tableau dashboard and the pros and cons of each method so you can choose the best method for your organization.
Jump to:
Sharing a Tableau dashboard via Server or Cloud
One of the ways users can share their Tableau dashboard is by publishing it on Tableau Server or Tableau Cloud. Below are the steps.
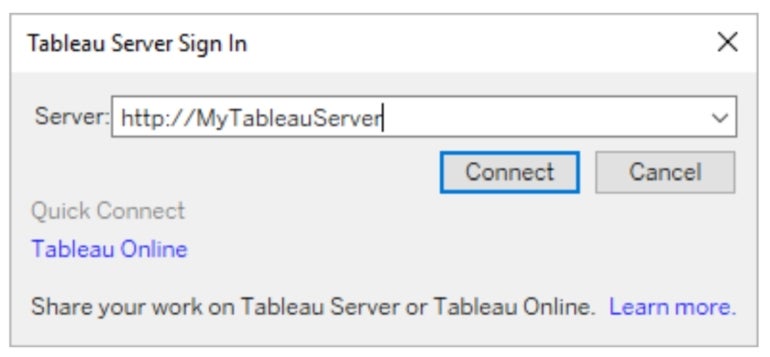
1. Launch Tableau on the Desktop or a web browser, navigate to Server and click on sign in (Figure A). You can choose either Tableau Server or Tableau Online (Cloud). For the server, enter the name or address of your Tableau server. If you go with Tableau Online, enter your username and password to sign in.
Figure A
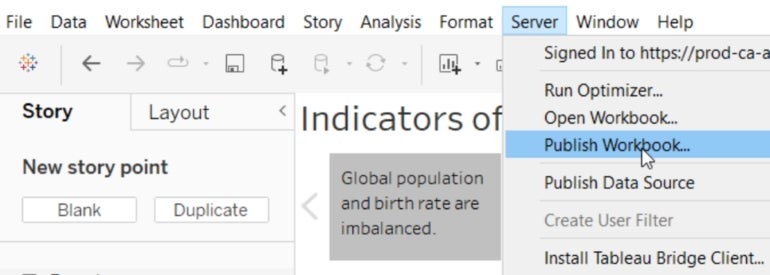
2. Once you are in, click on Server. From the dropdown menu, click on Publish Workbook (Figure B).
Figure B
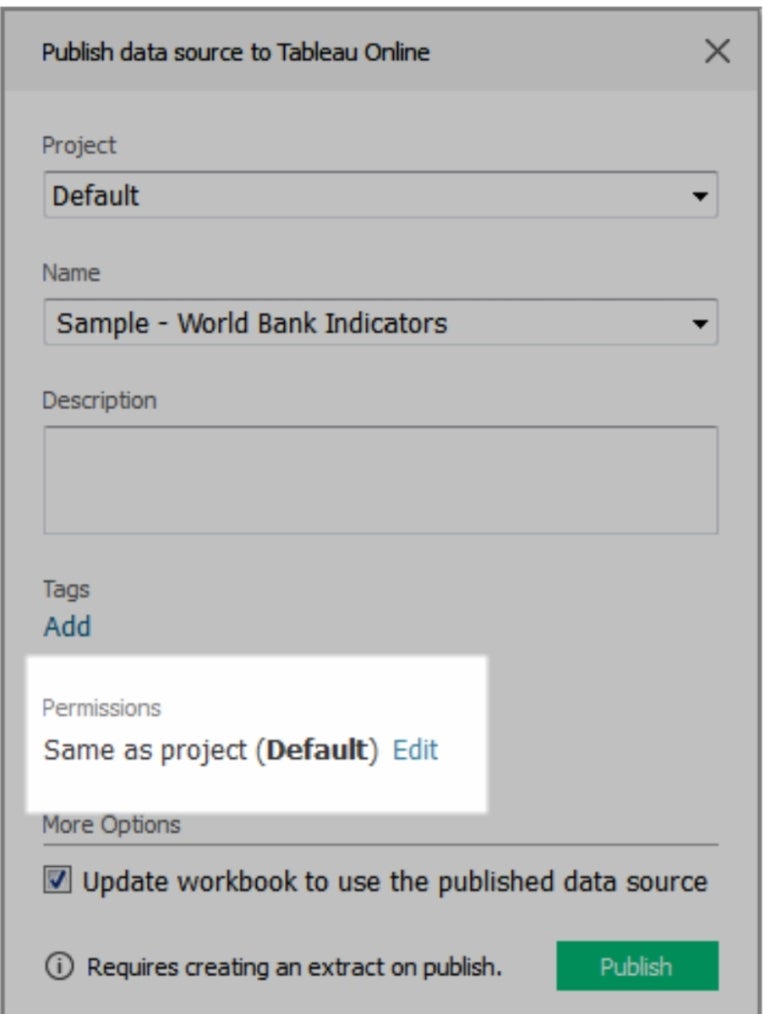
3. Select the project you wish to publish from the Publish Workbook dialog box.
4. Give a name to the workbook you want to publish or publish over an existing one.
5. To add extra security features to your workbook, go to Authentication and select Allow Refresh Access or Embed Password.
6. Once you complete the steps above, hit the Publish button and you are good to go (Figure C).
Figure C
Sharing and exporting as a PDF
Follow the steps below to share Tableau Dashboards as a PDF document.
1. On the dashboard, go to File. If you want to adjust the printing parameters, go to Page Setup. Otherwise, go to step 2.
2. On the File menu, click Print to PDF.
3. From the dialog box that pops up, set up the print range (Figure D). You can choose to print the entire workbook, active sheet only or selected sheets.
Figure D
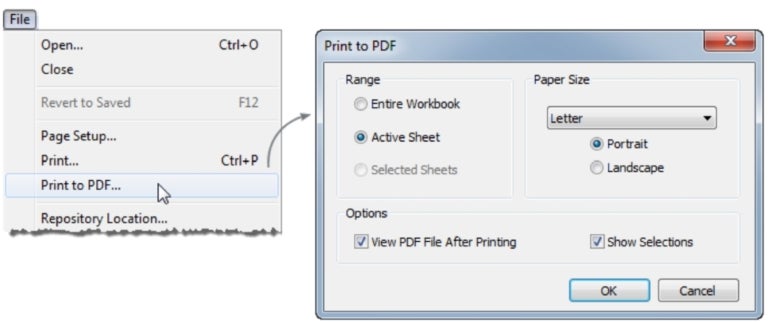
4. Choose the paper size and orientation that best matches the data you want to print.
5. Click OK, then choose the folder you want to save your PDF to and click Save.
Sharing and exporting as a PPT
You can also export your Tableau dashboard as a PowerPoint presentation. The steps are similar to the ones we took in the PDF option above.
1. Click on File.
2. From the dropdown menu, select Export as PowerPoint.
3. If you do not wish to export all the sheets to PPT, select the ones you want to include in the presentation.
4. After your selection, Click OK to save.
Sharing and exporting as a dashboard link
Follow the steps below to generate and share your dashboard link with other users.
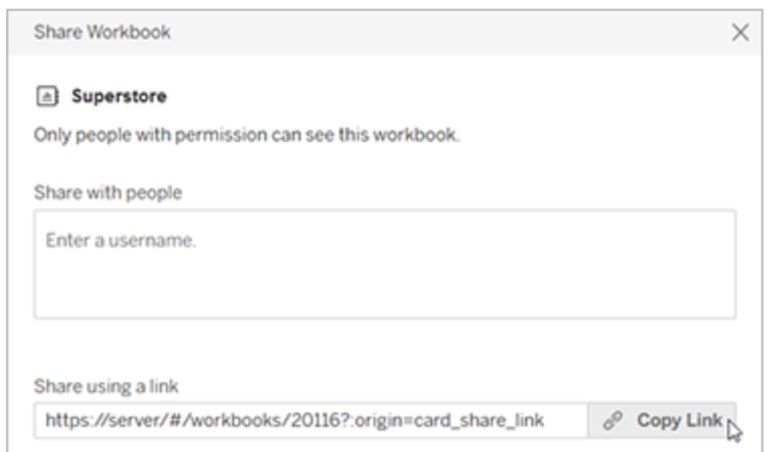
1. Open the Actions menu for the content you want to share.
2. Click on Share from the list of menu items.
3. If you already have the usernames of the people you want to share your data with, simply add their names in the box. Otherwise, go to the next step and pick the link.
4. A dialog box with the embedded code and the link will be displayed at the bottom.
5. Click on the Copy Link button to share it by email or other method (Figure E).
Figure E
Sharing as a crosstab (Excel or CSV files)
To share your dashboard as excel or CSV file, repeat the steps on the previous export options, and select Export as Crosstab to Excel. The file will then be exported in Excel or CSV format.
Understanding Tableau dashboards
Tableau dashboards are the main interface where all active analysis and data templates are displayed. The Tableau dashboard organizes and represents different data from many worksheets in a single space. The dashboard gives you options to filter data comparisons and visualizations from a large amount of data.
SEE: Explore everything you need to know about Tableau.
One of the most important features of the Tableau dashboard is that it displays data in a responsive way and can easily be shared with other users in various formats.
Key features of the Tableau dashboard
Below are some of the important features of the Tableau dashboard you should know.
Dashboard highlighting
On the Tableau dashboard, users can highlight specific items on the dashboard for better display using the Highlight button on the toolbar (Figure F). Once this feature is activated, users can either choose to turn on highlighting for some of the data they want to highlight or highlight all the fields.
Figure F
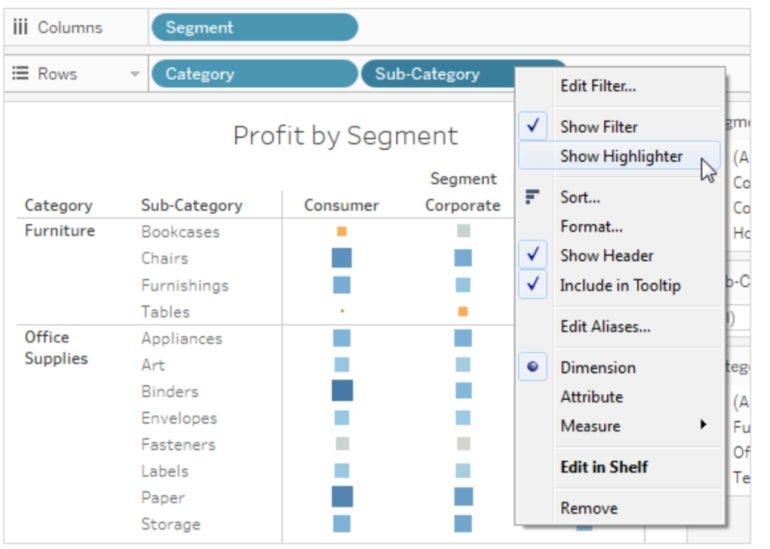
With this highlight action, users can easily call attention to areas of particular interest on the dashboard with the colors of their choice. Additionally, users can employ the highlighter tool to search for highlighted data in context or even create an advanced highlight action.
Dashboard filtering
The filtering feature allows users to specify which data is shown in the dashboard view (Figure G). Users also have the flexibility to customize each filter to suit different types of data in the view. They can choose from various options, such as displaying filters as multi-select checkboxes, single-select radio buttons, drop-down lists and more.
Figure G
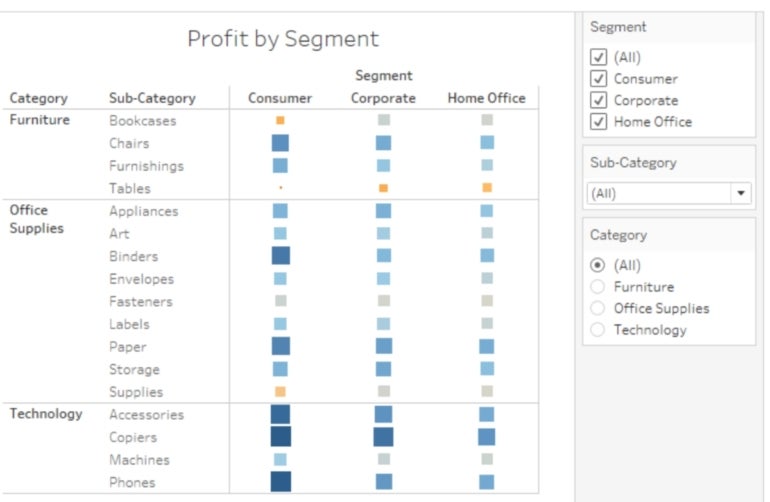
There is also an option to include a search button, enable the display of all fields, implement null controls and more. Users can also edit the title of a filter to provide clear instructions to viewers on how to interact with the data effectively.
Limited views
When users create a tableau dashboard, it can be shared with multiple viewers either in the same team or of the public. However, because allowing more than three viewers simultaneously affects the visual clarity and general performance of the data on the dashboard, Tableau provides the limited views feature to help users limit the number of people who can view their dashboard at the same time.
Automatic resizing
Tableau dashboards are typically set to a fixed size by default. Sticking with this setting could affect viewing in different screen sizes. To avoid this, users can choose the “Automatic” Size option, which allows Tableau to adjust the visualization dimensions based on the screen size automatically.
Add objects and set their options
Users have the option to incorporate diverse dashboard objects, including horizontal and vertical layout containers that facilitate grouping related elements and fine-tuning dashboard resizing during user interactions. They can also add text objects to provide headers, explanations and other relevant information, as well as image objects to enhance the visual appeal, with the capability to link them to specific target URLs.
SEE: Learn more about how to use Tableau.

