
Tableau is a powerful data visualization tool that is growing in popularity and enjoying a healthy market share. One of the reasons for its popularity is its ease of use. Even users with no coding experience can create beautiful and interactive complex visualizations using Tableau, making it a capable business analytics platform. The fact that it integrates well with many different data sources is another reason for its rising popularity.
One of the most commonly asked questions by users is how to concatenate in Tableau. If you have ever wanted to concatenate two fields together in Tableau, it’s actually a lot easier than you might think.
Jump to:
Understanding concatenation
What is concatenation? In everyday English, to concatenate means to join together. In Tableau, concatenation is the process of combining two or more fields into a single field. For example, you could concatenate a customer’s first and last name into a single field. The result would be a single field containing the customer’s full name.
There are several reasons why you might want to concatenate fields in Tableau. For one, it can make your data easier to work with. For example, if you’re trying to create a list of all your customers’ full names, it would be much easier to do if those names were stored in a single field. Additionally, concatenation can help you save space in your database. If you store customer names as two separate fields (first and last name), that takes up twice as much space as storing them in a single field.
SEE: Learn more about how to use Tableau in this guide for beginners.
Finally, concatenation can be used to create “calculated fields,” which is a field that is generated by Tableau based on the values in other fields. For example, you could use concatenation to create a field that contains the full address of each customer (i.e., street address, city, state, ZIP code). By concatenating multiple fields into a single field, you can make working with your Tableau data much easier.
Steps to concatenate in Tableau
To demonstrate, we’re using a simple data table that has six columns (Figure A): First Name, Last Name, Street Address, City, State and ZIP Code.
Figure A

1. Prepare your dataset
The first step is to prepare your dataset. The data needs to be in a compatible format such as .xlsx or .csv. You may also need to check and edit issues such as date formats and column headers to make sure the data is ready for use in Tableau.
2. Load the dataset
The next step is to connect the dataset to the Tableau dashboard. There are three methods that you can use to load a dataset into Tableau: uploading a file, using a connector or using an accelerator. The first step is to click New Data Source on the Data Menu (Figure B).
Figure B

This will open the Connect to Data window, where you can select the file you want to use.
Uploading a file is the simplest method — you can just drag and drop the file into Tableau. Using a connector is slightly more complicated, but it allows you to connect Tableau to a range of different data sources, including Salesforce, Google Analytics and Amazon Redshift.
Accelerators are prebuilt dashboards you can use to quickly visualize your data. They’re best for inspiration and ideas and you can also swap the existing data with your own. To use an accelerator, simply select the Accelerators option from the New Data Source menu.
For this demonstration, we are going to use the Upload a File option (Figure C). Simply drag and drop the dataset into Tableau.
Figure C

3. Understand the data
Now that you’ve loaded the dataset into Tableau, it’s time to take a look at the data and understand what it contains. The first thing you should do is open the Data Source page (you can find this under Data in the menu bar).
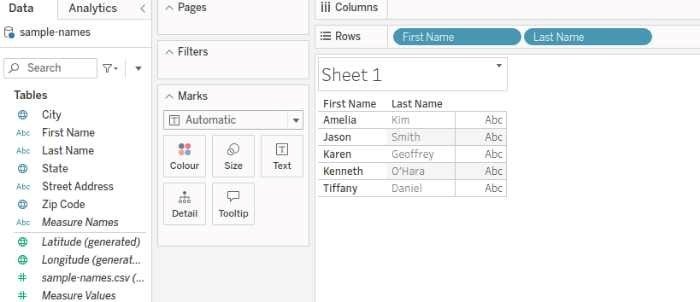
The Data Source page will show you all of the fields in your dataset as well as their data types. It’s important to understand the data types of your fields because it will determine how Tableau treats them when you start building visualizations. For example, drag the first name and last name fields into the rows shelf to view the data (Figure D). The two fields are text fields (Abc).
Figure D
4. Concatenate multiple fields
Now that you understand the data, let’s concatenate the first name and last name fields to create a single field for the people’s names. To do this:
1. Click the arrow next to the search button, and click Create Calculated Field from the menu dropdown (Figure E).
Figure E

2. In the new window, give the field a name (we’re calling it Full Name).
3. Drag the First Name field into the box and then the Last Name field. Ensure you have a separator (+ ” ” +) as shown in Figure F.
Figure F

You need to put a separator, in this case, a space character, between the First Name and Last Name fields when you concatenate them, so Tableau knows they’re two different pieces of information. This will concatenate the First Name and Last Name fields, separated by a space, into a single field called Full Name.
4. Now, if you drag this new field into the rows shelf, you will see that the data is displayed differently (Figure G).
Figure G

Now, let’s repeat the same process for the Street Address, City, State and ZIP Code.
5. Once more, click Create Calculated Field.
6. Rename the field Address, drag the four fields into the editor window, and add a separator between each field (Figure H). This will concatenate the various address elements into a single field.
Figure H
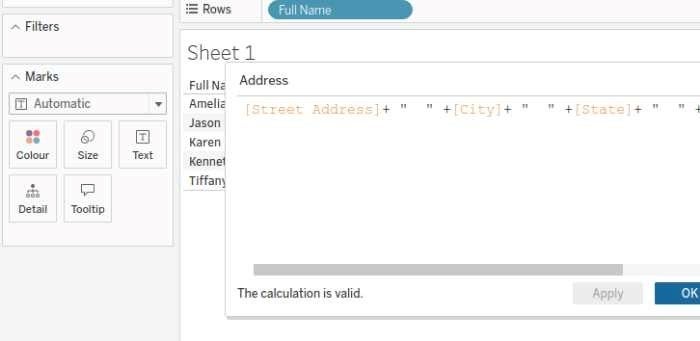
7. Once the formula is entered, click OK to apply it. The new field will now appear in the data pane and can be used like any other field in Tableau.
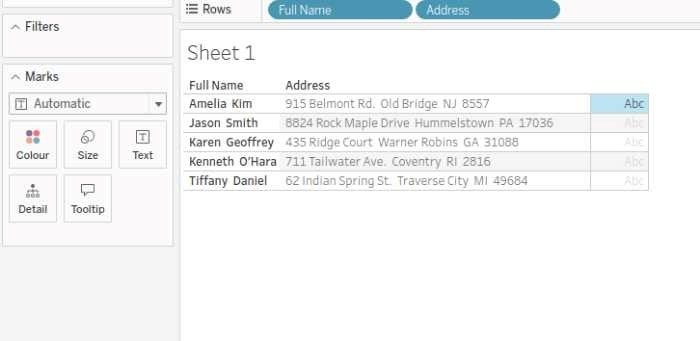
8. Drag it into the row shelf to see the new data (Figure I).
Figure I
Using the STR() function to concatenate nonstring fields
One potential issue you may encounter when working with data in Tableau is concatenating nonstring fields. For example, let’s say you have a field for ZIP code that contains only integers. If you try to concatenate this field with another string field, you’ll get an error message.
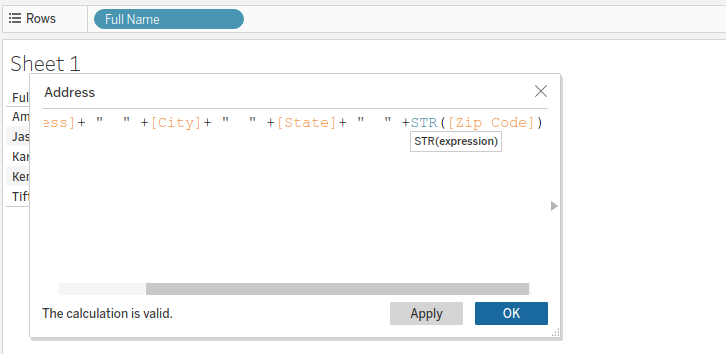
To avoid this problem, you must convert the integer field into a string using the STR() function. For example, in our data, we converted the ZIP code into a string (Figure J).
Figure J
Once you’ve done this, you’ll be able to concatenate the fields without any issues. Keep this in mind next time you’re working with data in Tableau, and you should be able to avoid any potential problems.
How to concatenate a date and string field
In Tableau, you can also concatenate a date and a string by using the STR() function to convert the date to a string first. Here’s an example:
Let’s consider a real-world example of this — imagine you are the data analyst for a phone sales company. You have a dataset that includes sales data for each product sold by the company. Each row in the dataset represents a single sale and includes fields such as the date of the sale (SaleDate), the product sold (ProductName), and the quantity sold (Quantity) as shown in Figure K.
Figure K

You want to create a new field that combines the SaleDate and ProductName fields into a single string, so that each unique combination of a date and a product has its own unique identifier. This could be useful for various reasons, such as identifying specific sales transactions or creating unique labels for a visualization.
Here’s how you would do this in Tableau:
1. Click on the arrow next to the search button and select Create Calculated Field from the dropdown.
2. In the new window, give the field a name (for example, SaleIdentifier).
3. In the formula box, type STR([SaleDate]) + ” ” + [ProductName]. This formula converts the SaleDate field to a string and then concatenates it with the ProductName field, with a space in between (Figure L).
Figure L
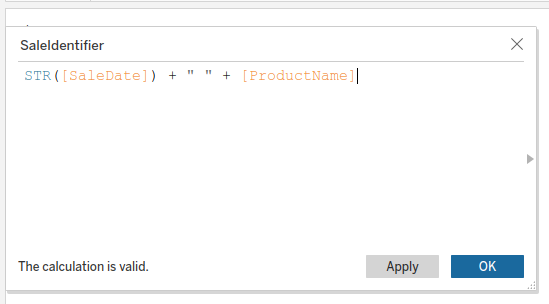
4. Click OK. The new SaleIdentifier field will now appear in the data pane and can be used like any other field in Tableau.
Tableau will populate the resulting SaleIdentifier field with concatenated strings that display the sales date and the product name, as shown in Figure M. Each unique combination of a date and a product will have its own unique identifier in this field.
Figure M


